REGRESSION LINE AND CORRELATION COEFFICIENT SCATTER DIAGRAM : LSUS
FURTHER MATHEMATICS SSS2 THIRD TERM
WEEK 10
REGRESSION LINE AND CORRELATION COEFFICIENT SCATTER DIAGRAM
Content
Definition: a scatter diagram is a graphic display of bivariate data. A bivariate data involves two variables
TYPES OF SCATTER DIAGRAM:
Linear positive correlation.
A positive correlation between two variables x and y means that in general, increase in x is accompanied by an increase in y. The regression line has a positive slope.
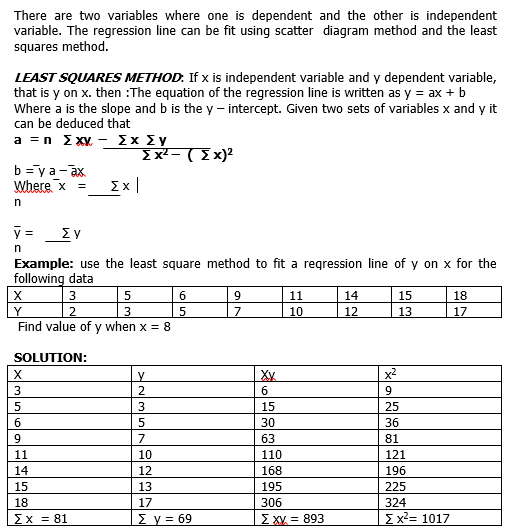
y = ax + b
y = 0.9873x – 1.37 (regression line of y on x )
Subscribe now to gain full access to this lesson note
Take Me ThereClick here to gain access to the full notes.


