Data Presentation.
Mathematics J.S.S 2 Third Term
Theme: Mensuration and Geometry
Sub Theme: Shapes
WEEK 9
Data Presentation.
Performance Objectives
Students should be able to;
- Draw pie charts
- Read information from pie charts
- Generate and use data for statistical purposes
- Interpret and use tables, charts, records and schedules
Pictogram
Content
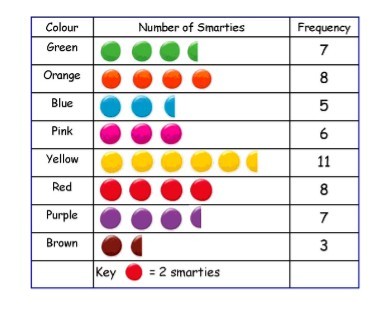
A pictogram uses pictures or drawings to give a quick and easy meaning to statistical data.

Bar chart
A bar chart represents the data as horizontal or vertical bars. The.... View More
Subscribe now to gain full access to this lesson note
Take Me ThereClick here to gain access to the full notes.

